
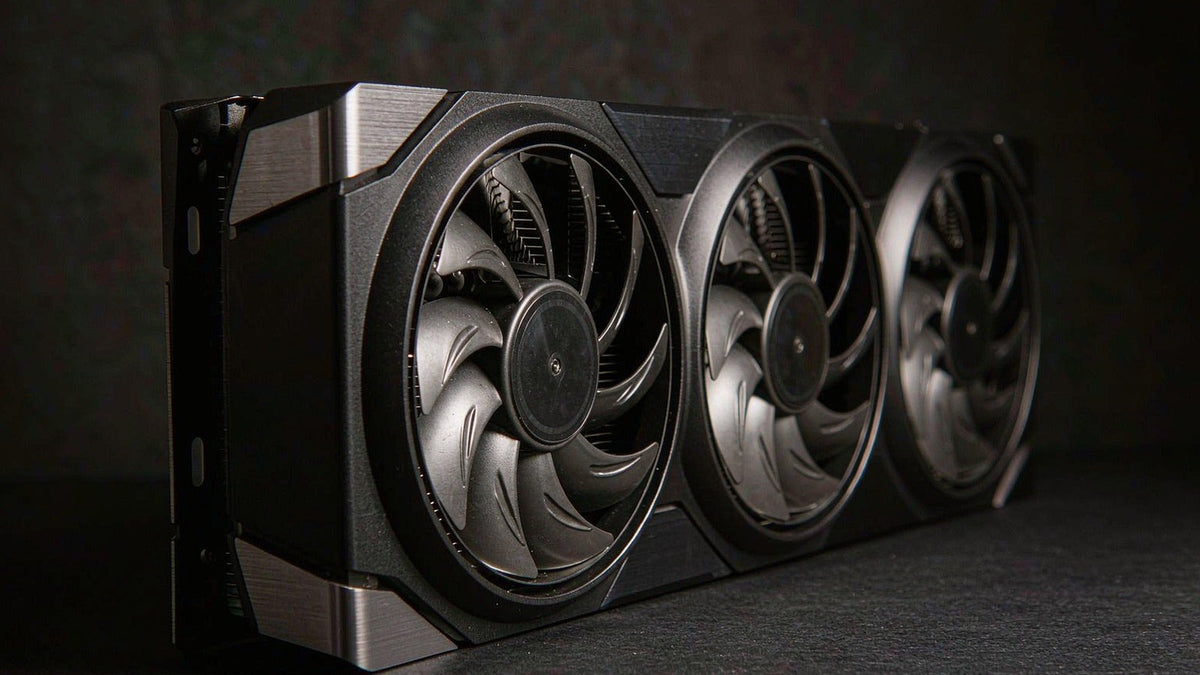
Discrete graphics card shipments returned to a four-year high in the second quarter of 2026.
The second-quarter 2026 figures published by Jon Peddie Research show two trends moving in opposite directions.
Desktop discrete graphics add-in boards shipped 12.5 million units, up 10% quarter over quarter and 6.6% year over year — the highest level since the first quarter of 2022, when 13.38 million units shipped. First-half shipments reached 24.3 million units, well above the 20.8 million of the same period in 2025.
Over the same quarter, desktop CPU shipments came to roughly 14 million units, down 10.5% quarter over quarter and 33% year over year.

One at a four-year high, the other close to halving year over year. Put those two curves on a single chart and an obvious question follows: who is buying all these graphics cards?

Source: Jon Peddie Research. Q2 2026 desktop CPU shipments of about 14 million units (-33% YoY) against 12.5 million discrete graphics boards shipped (+6.6% YoY).
What the 89% Attach Rate Is Actually Saying
The most easily misread number in this data set is the attach rate. For desktop discrete graphics, the attach rate rose from roughly 73% in the previous quarter to 89% in the second — a 23% quarter-over-quarter increase.
The definition needs clarifying first. An attach rate of 89% does not mean that 89% of desktop PCs sold came with a new discrete card. The metric compares graphics board shipments against the desktop CPU market as a whole, and upgrade purchases push it higher as well.
Precisely because of that definition, it points to something more significant: the growth is coming not from new system builds but from upgrades to machines already in use. Most people buying a graphics card already own a computer.
In other words, it is not that more people have started buying PCs. It is that people who already own one are more willing to spend on a graphics card.
«Buying More as Prices Rise» Is Not a Paradox
Conventional logic says rising prices suppress volume. The second quarter did the opposite: high-end graphics cards sold more even as prices went up.
«Defying common wisdom, high-end AIB sales spiked as prices increased. Our theory is consumers rushed to buy AIBs before the prices went any higher.» — Jon Peddie, President, Jon Peddie Research
There is an important implication here. Pull-forward demand moves purchases in time; it does not increase the total. It flatters the current quarter while borrowing from the next ones. Whether the trend holds into the third quarter is the test of that interpretation.
The core variable driving prices remains memory. GDDR7 contract prices rose about 55% in Q2. The cost pressure on graphics cards comes from capacity allocation upstream in the memory industry, not from the supply and demand of graphics cards themselves.
The Other Problem, Hidden Behind the 90%
The same report contains a number that attracts less discussion: market share. NVIDIA holds roughly 90% — about 11.25 million boards, its highest quarterly desktop volume since the third quarter of 2017. AMD holds about 8%, or roughly one million boards, and Intel about 2%, or roughly 250,000.
Quarter-over-quarter movement was negligible: NVIDIA down 0.1 percentage points, AMD down 0.16, Intel up 0.3. The market is growing. The competitive structure is barely moving.
The consequences of that concentration are concrete. For ODMs and board makers, product planning is bound to a considerable degree to a single platform roadmap. For regional distributors, negotiating room, stocking rhythm and the mechanics of regional price differences are all governed by the same variable. And a further consequence of limited competition is that the industry's downward pressure on prices has weakened. In this cycle, the push is coming from upstream, with almost no countervailing pull from downstream.
That is not a value judgement. It is a structural fact. For the PC ecosystem as a whole, market growth and ecosystem diversity did not move in step this quarter.
The Desktop Is Changing Shape
There is another thread hidden inside the CPU decline. When memory and graphics cards push up the cost of assembling a mainstream desktop at the same time, the barrier to a new build rises. The demand does not disappear. It changes form: upgrading an existing platform, deferring replacement, or moving to a more compact system.
That is why compact systems and small-form-factor machines have been discussed so persistently over the past year in commercial, light-office and education settings. A shift in form factor is usually a natural response to cost structure. When the marginal cost of one form rises too quickly, alternatives appear.
For system builders and board makers, that means product planning now has to run along two lines at once: performance upward, and form factor outward.

The Third Quarter Is the Answer
It is too early to draw conclusions. If the second quarter's strength really came from pull-forward purchasing, a slowdown in the third quarter is close to inevitable. If the third quarter holds, then the structure of demand has genuinely shifted.
Three indicators are worth watching: whether the desktop CPU decline is cyclical or structural; whether the attach rate can stay above 80%; and whether channel inventory days remain healthy. In a market with no spot buffer, inventory management matters more than price for the first time.
A single strong quarter is not enough to prove that demand will stay high over the long term. But this data set already carries a longer-term message: what a PC is, as a question, is being answered again.


Leave a comment
All comments are moderated before being published.
This site is protected by hCaptcha and the hCaptcha Privacy Policy and Terms of Service apply.